


Eamonn Butler's latest blog looks at Adam Smith's time at Oxford and Glasgow where he learned first hand that incentives matter - especially in Education.

It's not an unusual complaint these days, companies sit on vast lakes, reservoirs' worth, of cash and don't seem to do much with it. Something must have changed so what is it? At least part of the answer, accounting for just under a third of it, is that the world of business has changed. Well, obviously, but we've identified one of the ways that it has:
I explore the role of the just-in-time (JIT) inventory system in the increase in cash holdings by U.S. manufacturing firms. I develop a model to illustrate the mechanism through which JIT affects cash and quantify its impact. In the model, both cash and inventory can serve as working capital. As firms switch from the traditional system to JIT, they shift resources from inventory to cash to facilitate transactions with suppliers. On average, this switchover accounts for a 4.1-percentage-point increase in the cash-to-assets ratio, which is approximately 28% of the change observed in the data.
Back decades a company might sit on months of inventory, today perhaps hours. That needs less working capital to finance the inventory of course, but also more ready cash to pay suppliers. What happens to the net investment position depends upon the balance of those two effects.
Our own guess at it, and it is a guess, would be that the reduced working capital demands outweigh the greater liquidity demands. Thus rather neatly explaining something else people seem to worry about, the decline in corporate use of capital itself.
There is also a larger point to make here, we must always be very sure that we are distinguishing cyclical changes from structural. It is possible, for example, that people might use corporate demands for cash or working capital as a measure of the state of the economy. OK, fine, why not do so? But when we do so we've got to make sure that as the underlying technology, and thus the structural demands, change we do not confuse the two, the structural and the cyclical.
Our favourite example of this error was a measure of business software investment. That this is static was used to argue that there was no great technological revolution going on and therefore we faced secular stagnation. The problem being that business increasingly rents its software, not buys it. Office and Office 365 both do the same thing, but Office is an investment, 365 a current expense. Business was indeed therefore "investing" more in software, by the amount of the size of the software as a service market, but this was completely missed by the use of the investment statistic.
Or, as we like to say, it's no use looking at an economic statistic unless you understand, in detail, what it is actually measuring and why
The central element of the Bank of England’s narrative on the UK banking system is the ‘Great Capital Rebuild’. To paraphrase Governor Carney’s comments when the 2015 stress tests were released: the post-Global Financial Crisis (GFC) period and the long march to higher capital are over. The message – which he has repeated since – is that UK banks are now more or less fully capitalised.
Unfortunately, the ‘Great Capital Rebuild’ is a fiction.
Let’s look at the evidence. Exhibit A is the following chart (Chart B.2) from the BoE’s November 2016 Financial Stability Report.
Major UK Banks’ Leverage Ratios

Sources: PRA regulatory returns, published accounts and Bank calculations.
(a) Prior to 2012, data are based on the simple leverage ratio defined as the ratio of shareholders’ claims to total assets based on banks’ published accounts (note a discontinuity due to introduction of IFRS accounting standards in 2005, which tends to reduce leverage ratios thereafter). The peer group used in Chart B.1 also applies here.
(b) Weighted by total exposures.
(c) The Basel III leverage ratio corresponds to aggregate peer group Tier 1 capital over aggregate leverage ratio exposure. Up to 2013, Tier 1 capital includes grandfathered capital instruments and the exposure measure is based on the Basel 2010 definition. From 2014 H1, Tier 1 capital excludes grandfathered capital instruments and the exposure measure is based on the Basel 2014 definition.
This chart shows some of the BoE’s own estimates of UK banks’ leverage ratios spanning 2001 to 2016: the leverage ratio is the ratio of some measure of capital to the total amount at risk. This chart indicates that UK banks’ leverage ratios are a little higher than a decade ago – maybe 25% on this measure, but certainly no multiple – and a decade ago the banks were on the eve of an almighty crash.
Now comparing leverage ratios before the GFC and after is a tricky business because of definitional changes made by Basel III. Yet the Bank itself publishes figures for two leverage ratios known as Simple Leverage Ratios (SLRs): the ratio of shareholder equity to total assets. One refers to the book value of shareholder equity and the other to the market value of shareholder equity. These series give average SLRs across the banking system and span the period from before the GFC until recently. [2] To the extent that we can rely on these to give us a before and after comparison, the average book value SLR was just under 4.1 percent in 2006 and 6.2 percent in the first half of 2016, representing an increase of 51 percent. [3]
The corresponding market value SLR was 8.0 percent going into 2006 and 5.28 percent in November 2015, representing a decrease of 34 percent. [4] By this latter measure, UK banks are more highly leveraged now than they were going into the crisis.
I would suggest that it would be prudent to pay attention to these market value figures: the market values being less than book values is a signal that the market perceives problems with the book values.
Then consider that the big four banks’ total Common Equity Tier 1 (CET1) capital was about £205 billion by the end of 2016q3. This figure is barely £90 billion higher than the £116 billion Tier 1 capital that they had going into 2007, although one must acknowledge that this £90 billion difference does not allow for the considerable improvement in quality between Basel II Tier I capital and Basel III CET1.
The 2016q3 £205 billion CET1 number is a book value figure, however, and the corresponding market value of its CET1 capital was about £149 billion.
We should also assess these numbers against the sizes of the banks’ balance sheets, and it is traditional to use Total Assets as such a measure. Given that their Total Assets were just under £5 trillion at the same date, their average CET1 leverage ratio (or ratio of CET1 capital to total assets) was 4.0 percent if we go by book values and just under 3 percent if we go by market values.
By the first measure, UK banks are leveraged by a factor of 1 divided by 4 percent or 25: they have £25 in assets for every £1 in capital; and by the second measure, they are leveraged by a factor of over 33. These are high levels of leverage that leave the banks vulnerable to shocks – and high levels of leverage aka inadequate capital were a key factor contributing to the severity of the GFC.
Putting all this together, the evidence for a ‘Great Capital Rebuild’ is not there – especially if one pays attention to the market value numbers.
As a further confirmation, Chart B.3 in the Bank’s November 2016 Financial Stability Report states that “Most capital rebuilding to date has reflected falls in risk-weighted assets” – a delightful piece of duckspeak – and then gives a breakdown of this ‘rebuild’ in terms of its constituent components. The rebuild it is referring to is not quite what it might seem, however: it refers to the rebuild in the banks’ average ratio of CET1 capital to risk-weighted assets (RWA) relative to 2009. Now the CET1 ratio was 6.92 percent in 2009 and had risen to 12.61 percent by end-2015. That increase breaks down into 0.45 percentage points in new equity raised, 1.02 percentage points in retained earnings and 4.22 percentage points in reductions in risk-weighted assets. Therefore, only 1.47 percentage points of that increase in the capital ratio represents actual increases in capital; the rest, the 4.22 percentage points decrease in risk-weighted assets merely reflects the decrease in the denominator. I would suggest that the chart should have stated “Most of the increase in the ratio of capital to RWAs to date has reflected falls in risk-weighted assets” but that doesn’t quite convey the same message. The increase in the capital ratio from 6.92 percent to 12.61 percent might seem impressive at first sight – an increase of 82 percent – but the actual capital rebuild was only from 6.92 percent to 8.39 percent, an increase of about 21 percent.
A big increase in a regulatory capital ratio is one thing, but a big increase in actual capital is quite another.
Let’s face it: the ‘Great Capital Rebuild’ is not there in the data.
[1] Kevin thanks Sir John Vickers for helpful inputs to this posting.
[2] These figures will overstate the leverage ratio and understate true levels of leverage because they use the larger Shareholder Equity measure rather a narrow core capital measure such as Core Tier 1 or CET1, but they give some sense of the trends over time.
[3] These figures are to be found on p. 57 of the Bank’s November 2016 Financial Stability Report.
[4] These figures come from the BoE Excel workbook ‘ccbdec15.xlsx, spreadsheet ‘9. Bank equity measures’ under the C column, ‘Market-based leverage ratio (%)’. This workbook was accessed on March 9th 20616 but appears to have been removed from the BoE website since the time I accessed and downloaded it.
Over the decades the definition of poverty has changed, from meaning someone not having very much to someone having less than others. That move from measuring poverty to relative poverty turns it from a measure of actual poverty into one of inequality. The reason this was done is obvious, Britain abolished absolute poverty in the 1930s and where would the left be without something to whine about?
We are fortunate to be witnessing an attempt to again redefine:
More than a million people in the UK experienced destitution in 2015, including 312,000 children, according to a groundbreaking study by Heriott Watt University academics for the Joseph Rowntree Foundation published last year. It defined destitution in two ways: experience of at least two of six poverty measures over the previous month, including eating fewer than two meals a day for two or more days; or a weekly income after housing costs of £70 for a single adult or £140 for a couple with children. This was an income level below which people “cannot meet their core material needs for basic physiological functioning from their own resources”.
A definition of destitution which defines it as only two meals a day twice a month is rather co-opting a word with a very strong meaning to cover something really quite different.
We should also note, as we so often do, that this definition is before the things which people other than the state do to alleviate such distress.
What we are seeing here is an attempt to float another redefinition, like that to relative poverty measures, in order to show that there is some vast problem which needs more tax to solve.
The first and prime lesson of economics is that incentives matter - grasp that there are always opportunity costs and with those two you've got the basics of the subject nailed - and this extends even to the timing and manner of death:
A bizarre trend is said to be afoot in villages bordering the Pilibhit Tiger Reserve (PTR). Authorities suspect local families are sending older members into the forest as tiger prey, and their bodies then relocated to fields, to feign attacks and claim lakhs in compensation from the government.
Villagers aren't entitled to compensation if their kin die in the reserve.
Depending upon how large the compensation is this could be bizarre or not. Put a sufficient number on the head of dead grannies anywhere and elderly women are going to be at risk from their kin. But it is, allegedly at least, not the youngsters offing the elderly in the hops of a payout:
Locals, however, say family elders were willing participants in the whole affair. "They think that since they can't get resources from the forest, this is the only way their families can escape poverty," farmer Jarnail Singh, 60, told TOI.
We also have reasonable evidence that changes in tax law regarding estates can change the timing of death.
The lesson from this being perhaps uncomfortable for the more radical egalitarians among us. Assuming that tiger story is true some people are willing to quite literally sacrifice themselves for their children in just economic terms. Which means that it's really going to be very difficult indeed to reach a society in which parents do not actively conspire to privilege their own children over those of others. Even radical measures like 100% death taxes, a pure insistence upon absolutely equal schooling for everyone, we're still going to have people working to create that inequality.
A society without any form of inherited privilege just isn't going to work because humans ourselves just don't seem to work that way.
Gary Becker pointed out that prejudice was costly to the person who was prejudiced. By refusing to hire perfectly reasonable workers just because of the colour of their skin this leaves the employer with less profit than they could have had. In time the knowledge will spread, that these now cheaper because of the discrimination workers are just fine and they will be hired by others less prejudiced. Again, in time for nothing is immediate in a market economy, the prejudiced will find themselves out competed and thus does that prejudice disappear from the workings of the economy even if not the minds of men.
It's worth noting that this was the reason for the Jim Crow laws. The prejudiced used the state to enforce what they knew the market would not.
This applies not just to race of course, it applies to any form of taste discrimination. Which brings us to something fun about the Venture Capital industry:
The vast majority of venture capitalists in the United States are men. But the distribution of women partners across VC firms is not uniform. It turns out that companies whose male senior partners have daughters are more likely to hire women as partners. And according to research published earlier this month by Paul Gompers and Sophie Wang, those companies secure superior investment returns — strong evidence that an irrational opposition to hiring women partners is holding VC firms back.
It is possible to devise reasoning as to why men are just going to be better at being a VC than women. It also seems that such reasoning would be wrong. So, why hasn't this been outcompeted then?
The answer being that "it takes time" bit. The market is a pretty wondrous human institution but it's only in the pages of the wilder textbooks that information is perfect or that things happen instantaneously. This is new information--and we know from the efficient markets hypothesis that markets are indeed efficient at incorporating new information into prices. We should thus expect rather more hiring of female VC partners and executives and thus the diminution of that prejudice.
Assuming the study itself is correct those that don't will lose out. And what the hell do we care about that? This is capitalism, recall, and people are entirely allowed to waste their money their own way. Those who continue in prejudice, once it has been pointed out to us all so that we react, will lose money. And what better way to punish a capitalist than that?
That is, we don't actually need to do anything other than to prove this very point, that this is taste discrimination, not rational. Once that is known we can confidently expect it to disappear--for exactly the same reason those Jim Crow laws enforcing discrimination existed. Once people know they're losing money they stop doing silly things if only the law will allow them.
Labour’s pledge to abolish tuition fees was the most memorable and (regrettably) popular policy of the last General Election. Unfortunately, it didn’t receive anywhere near the level of scrutiny it deserved, many outright falsehoods went unchallenged with Theresa May relying on the old ‘Magic Money Tree’ trope that might have worked at the past two elections, but clearly wasn’t enough here.
At Jeremy Corbyn’s post-election rally, he claimed that “fewer working class young people are applying to university. Let's end the debt burden and scrap tuition fees!”. Now I do not know if Corbyn is a cynical liar or merely incompetent – it’s entirely possible he’s both – but what he said was simply not true.
Since tuition fees were brought in the number of disadvantaged students, as measured by eligibility for free school meals, applying to university has actually increased. As Jo Johnson, the Minister for Universities, points out – disadvantaged young people are actually 40% more likely to apply to university now than in 2010.
Of course, you might wonder whether we’d have even more disadvantaged young people going to university if we’d abolished tuition fees altogether. That’s a perfectly reasonable claim. It just so happens to be false.
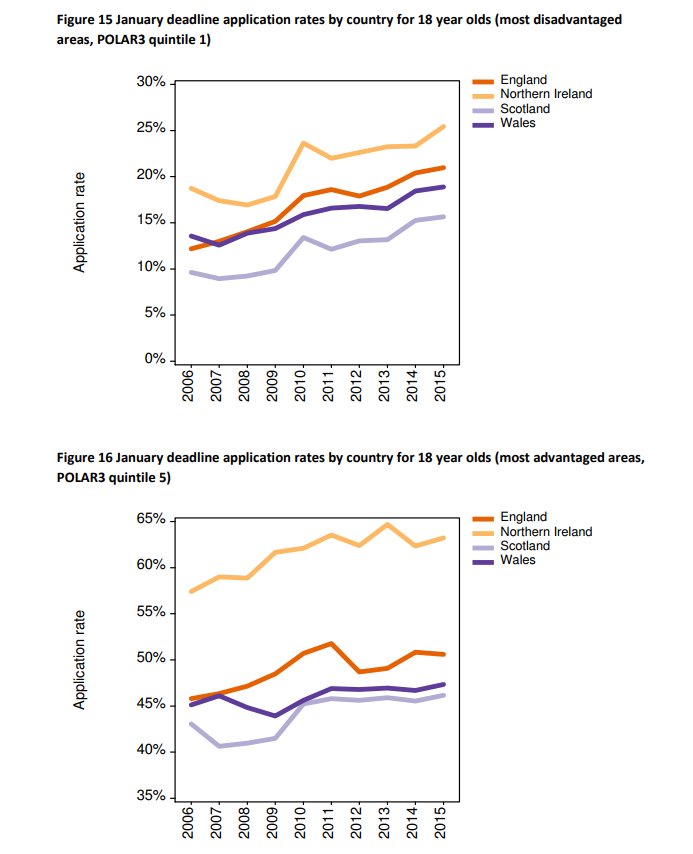
Scotland, where tuition fees have been abolished since 2007, provides us with an excellent natural experiment. Are we more likely to make progress on getting disadvantaged young people to apply to university with fees abolished? The answer is no.
In 2007, Scotland used to do about as well as England at getting young people from disadvantaged areas to university. But if you track a graph from 2007 to 2015, you see that both nations get better at encouraging students from poorer areas to apply but England does substantially better and the gap between England and Scotland is larger today than it was before fees were abolished.
Interestingly, if you take the same graph but look at young people from advantaged areas instead, you get a very different result. Applications rates for the well-off fell since tuition fees were tripled in England, while they increased for the well-off in Scotland.
If your goal is ensuring that anyone who wants to can go to university then abolishing tuition fees simply won’t work.
Advocates of free tuition typically ignore this evidence and instead frame their arguments in terms of fairness. But there’s nothing fair about free tuition.
Abolishing tuition fees would cost £11bn coming out of general taxation. In other words, people who didn’t benefit from receiving a university education and will most likely earn less than graduates will be forced to pay more in tax to fund well-off graduates. At a time, when we have a £50bn deficit, funding pressures on the NHS, schools and social care, and the highest tax burden in decades, is it really wise to fund a cash transfer that well-off graduates will benefit from the most?
But that’s not the only way it’s unfair. Privately-educated children are much more likely to attend university than children on free school meals. Abolishing fees doesn’t change that (as the evidence from Scotland shows), but it does mean that a greater share of public money will be spent on the children of the well-off.
Another argument that usually crops head up is the ‘public good’ argument. Now when someone says education is a public good they don’t mean it in the traditional economic sense, they mean it in the same way this confused Vox writer does. Essentially, they think that education is a good thing and it’d be better if we saw more of it because it benefits not just the individual but society as a whole. But that’s not an argument for higher education to be fully funded by the state. In fact, tuition fees were originally introduced to increase university funding allowing them to expand the number of spaces on offer. And raising fees to £9,250 a year enabled the government to lift the cap on university places allowing more people than ever to go. The ‘public good’ argument just doesn’t hold water.
The status quo isn’t perfect. We need to ensure that students really are getting value for money. That means equipping them with all the facts. Prospective students should have good quality information about how much they can expect to earn (and to repay) not just a few years on from university but 10-15 years down the line.
The 23 universities where graduates earn less than non-graduates should be named and shamed.
We should also look into broadening the options available to young people. Why not encourage universities to offer two-year degrees to attract students who don't want to pay full fees but still get a quality education?
Abolishing fees would be expensive and unfair, but it'd do nothing to resolve the real problems in higher education.
We've often wondered what the purpose, the point, of Yvgeny Morozov is. This puzzlement has not been reduced by his latest offering. Those big American tech companies own all our data thus, well, thus something must be done!
All of the nation’s data, for example, could accrue to a national data fund, co-owned by all citizens (or, in the case of a pan-European fund, by Europeans). Whoever wants to build new services on top of that data would need to do so in a competitive, heavily regulated environment while paying a corresponding share of their profits for using it. Such a prospect would scare big technology firms much more than the prospect of a fine.
The current approach – let’s have big tech firms swallow as much data as they can and apply competition law to how they design their websites – is toothless. Fixing online shopping is important but not if it accelerates the transition to a perverse form of data feudalism, where the key resource is owned by just one or two corporations.
We're a lot less worried about a company turning a buck by putting together our rampant doughnut habit, our GSP location and the ad from the local baker than we are by the idea that the government owns all this stuff. The temptation to use it to eliminate Bad Thought would seem to be rather greater among those not motivated by lucre and pelf. Governments and such information don't have a good historical record.
And as to feudalism, the definition was that the government owned everything, we all just gaining it upon licence, wasn't it?
The greater problem though here is economic. The data itself isn't worth anything at all. That's why we all, individually, give it away. It is the very process of collecting and processing it which adds value. There is no value add here other than the systems which do that, those tech giants being the systems that do.
Think of Ricardo and what that means for resource rents. The simple existence of some resource, oil, gold, diamonds say, belongs to no one as no one has actually created that resource. The implication being that the government of the area should tax the simple existence value of the resource until the pips squeak. Revenue's got to come from somewhere, it should come from non-distortionary sources, taxing what no one has created cannot change the effort into creation, can it?
But we all also agree that the people who invest capital, effort, time, into developing those resources should indeed profit from having done so. Incentives do matter after all.
At which point, if there is no resource here, only the effort, then what taxation of the resource rent should there be?
If it is true, as we maintain it is, that it is the collection and processing of the data itself which adds the value then what is there for the government to own?
This is simply absurd from the Daily Mail:
Apple has paid barely 1 per cent tax on its UK sales, despite raking in £7.5billion here since the iPhone launched, a Daily Mail investigation has found.
Britain doesn't have a turnover tax on companies - VAT is paid by the consumer. Britain does have a profits tax and thus whatever the tax paid is determined by those profits, not turnover.
Sadly, Vince Cable gets worse:
Last night, critics said Apple's apparent determination to avoid contributing was a scandal that shamed international business.
Former Lib Dem business secretary Sir Vince Cable said: 'It's absolutely outrageous that the tax base doesn't reflect economic activity and is based on artificial declarations of profits.
'Taxation has become voluntary for these companies, and the tax base has got to change.'
As HMRC has pointed out more than once this is how the current profit tax system operates, it taxes profits where the economic activity which produces them takes place.
Consider what makes Apple's profits. It's not selling a phone after all. We can all go and buy some landfill Android for £20. The reason people buy Apple is some mixture of the brand, the design, the software and so on. All of which are "made" in California. And thus the profits from that are taxed in the US, as the national taxation regime, and in California, the local one, under whatever the rules in place for the taxation of profits there are. No, we don't get to whine about Bermuda, repatriation or whatever, that's all the US tax system, not us.
This is not some failure of the corporate taxation system, this is the very purpose of it. Profits are taxed to reflect the economic activity which produces them. This is what Vince wants, this is what Vince has, so why is he complaining? It couldn't be that he's just a politico on the stump, could it?
