
The Bank of England on house prices: why it's still the supply side, stupid
Are houses expensive in the UK because of inelastic supply, or because of lower interest rates? The answer, according to a new paper from the Bank of England, is both. In this paper’s model, constrained supply and falling real interest rates act like two blades of a scissors. Over the past forty years they have together led to house prices having roughly doubled compared to incomes, while rents have remained at roughly the same share (around 40% of people’s incomes).
The model is similar to the one outlined by Ben Southwood here. To restate what he says, the rental cost of a house (ie, how much it costs to live there for one year) is determined by simple supply and demand. The cost of buying a house is determined by how much people expect it to cost to rent the house for the lifetime of the house – effectively, you’re paying up front for the total lifetime use of the house.
But you could always rent today and invest that money in something else, rather than the house. So what you’re willing to pay today for the total lifetime rental value of the house, and what the current homeowner is willing to accept, depends on the opportunity cost of the money you’d be spending. The “opportunity cost of investment” is what we generally refer to as the “real interest rate” – the average risk-free investment you can make. Lower real interest rates mean the opportunity cost of investing in a house is lower, so people are willing to spend more on doing so.
And as the Bank of England paper shows, this is exactly what has happened in the UK since 1980: as the real interest rate has fallen, the price of houses has risen. And they demonstrate that this has been enough to account for all of the rise in house prices over this period – not immigration, not quantitative easing, and not a change in the restrictiveness of our planning laws.
But this rests on a crucial fact about our housing market: that supply is inelastic, or in other words that higher demand does not lead to higher supply as in the markets for most other things. If everyone decided that blueberries were a superfood and we all needed to eat half a pound of them a day, would we expect the long-term price of blueberries to rise? Not really – we’d expect more farmers to produce blueberries, and barring some kind of barrier to production we couldn’t overcome, for the long-term price of blueberries to remain roughly the same.
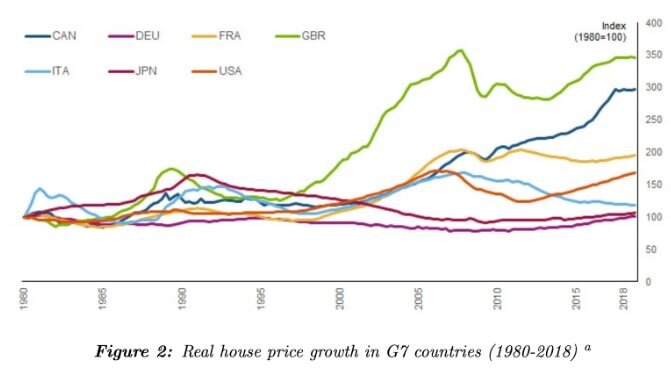
As the paper shows, while most G7 countries have experienced quite a lot of house price growth since 1980, the UK has had by far the most – Germany, Japan and Italy have had almost no inflation-adjusted increase in house prices, and the USA has experienced less than a doubling of prices over that time.
Since real interest rates have been similar across these countries over this period, real interest rates alone cannot explain the UK’s extremely high house price growth. Applying the sorts of supply and income elasticities that are present in Japan or Denmark (still considerably less elastic than the US) to the UK experience gives a much smaller real house price growth: 88%, instead of 173% that their model implies. Even when we only look at the national picture and do not focus in on the places like London where demand and costs are highest, something is badly wrong.

There is a second point that the authors mention: the constancy of rents as a percentage of income over time (adjusted for quality improvements, imperfectly). This is taken by some to mean that there is no problem in the rental market – and, hence, that the fundamental factors of supply and demand are working healthily in the housing market.
But think about what this actually means: every time someone gets a pay rise, a large fraction of that pay rise immediately is gobbled up by their rent. If everything I spent money on acted this way, pay rises would be meaningless – I would be no better off at all.
The paper’s authors find that around 40% of people’s incomes go on rent. That means that forty percent of whatever pay rises people have gotten for decades has gone to landowners rather than to them. In a market where supply was more elastic, we would not expect this to be the case. It isn’t the case in the markets for clothes or cars, or even for durable goods like ships or airplanes.
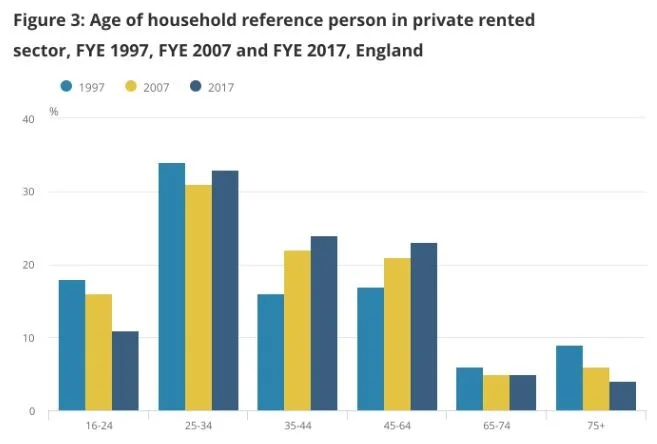
The proportion of renters has increased significantly over time as well, by from 13% to 20% in private rented accommodation in the ten years to 2017. And the age that people stop renting is rising too, so more and more people in their forties are still renting when previously they would have bought a house. So 40% of disposable income and pay rises going on rent is a much bigger problem now than it was thirty or forty years ago – a graph showing rents remaining constant as a share of income can obscure a huge change in the number and composition of people who are renting.
And this doesn’t apply to homeowners - the value of their asset rises when average wages rise. It’s only renters who see their future costs rise like this when incomes rise.
I regard this paper as an important, high quality contribution to the debate, and strong evidence that the supply side in Britain’s housing market is extremely broken. Moreover, it is the side of the equation we can do something to fix – real interest rates are driven by fundamental economic factors that governments can only indirectly affect, and with great difficulty, whereas the elasticity of housing supply is something that the government currently constrains directly via the planning system. And solving that may be less politically difficult than it seems.