
Are Bank Capital Requirements Really Ten Times Higher than Before the Crisis?
A major theme in Bank of England speeches over the last three years has been the ‘Ten Times’ story: bank capital requirements are now 10 times higher than what they were at or before the time of the GFC. Here are some examples:
- “Capital requirements for banks are much higher … In all, new capital requirements are at least seven times the pre-crisis standards for most banks. For globally systemic banks, they are more than ten times.” (Mark Carney, 2014) [1]
- “ … the capital requirements of our largest banks are now ten times higher than before the crisis.” (Mark Carney, 2015) [2]
- “Common equity requirements are seven times the pre-crisis standard for most banks. For global systemically important banks (G-SIBs), they are more than ten times higher.” (Mark Carney, 2016) [3]
- “The largest banks are required to have as much as ten times more of the highest quality capital than before the crisis … (Mark Carney, 2017, his emphasis) [4]
This latter claim is particularly significant because Governor Carney is referring to the largest banks in the world and was writing in his capacity as chairman of the Financial Stability Board (i.e., as the world’s most senior financial regulator) to the leaders of the G20 countries. He could hardly have chosen a more conspicuous forum in which to make his point.
At first sight, these claims are very reassuring. After all, if bank capital requirements are now ten times greater than they were before the GFC, that must mean that our banks are now much more resilient, right?
Wrong.
Let’s consider the evidence.
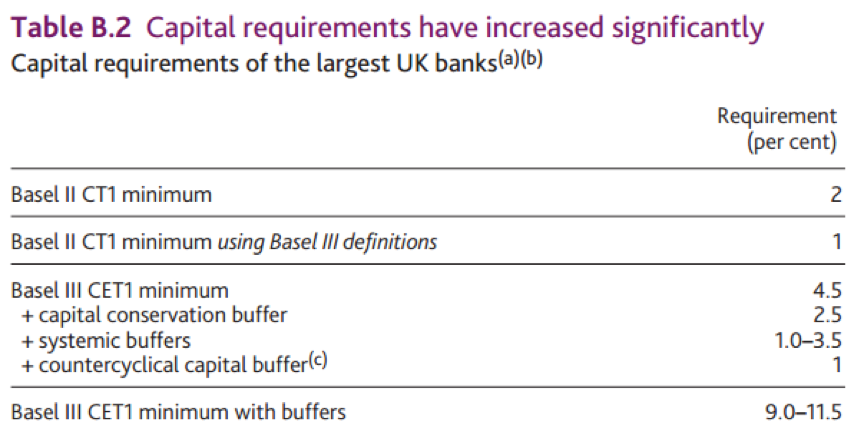
The evidence for Governor Carney’s claims would appear to be the capital requirements in the following Table (Table B.2) from the Bank’s July 2016 Financial Stability Report:
Notes to Table B.2:
(a) Expressed as a proportion of risk-weighted assets. An additional 1.5% of risk-weighted assets must be held in at AT1 [Additional Tier 1 capital] as part of the Basel III Pillar 1 requirement. UK banks are also subject to Pillar 2A requirements.
(b) See Caruana, J. (2012) ‘Building a resilient financial system’, available at www.bis.org/speeches/sp120208.pdf.
(c) in a standard environment.
This Table indicates that the minimum Basel II core Tier 1 (CT1) capital requirement was 1 percent using Basel III definitions. The lines below show the additional requirements for the ratio of Common Equity Tier 1 (CET1) capital to Risk-Weighted Assets (RWAs), which sum to 9 to 11.5 percent depending on the settings for the systemic and countercyclical capital buffers. The systemic buffer is likely to have an impact of no more than 0.5 percent of RWAs, however.[5] As for the countercyclical buffer, the Bank of England announced on June 27th that this buffer would be raised from 0 percent to 0.5 percent. Therefore the actual value of the ‘Basel III CET1 minimum with buffers’ term at the bottom of the table should be no more than 8 percent, but let’s call it 8 percent to be on the generous side.
One can then say that CET1 Pillar 1 capital requirements involving RWAs are currently 8 times their Basel II counterparts. One can also say that the system envisages the potential for CET1 ratio capital requirements to be 11.5 times their Basel II counterparts – and even higher if one takes account of higher systemic buffers or a higher countercyclical capital buffer or the Pillar 2A requirements mentioned in Note (a) of the Table.
At first sight, such an increase in capital requirements might appear impressive. But consider the starting base. Under Basel II, RWAs could be a hundred times bank capital. When calculating its supplementary leverage ratio buffers the Bank uses a working assumption that the ratio of RWAs to total assets is 35 percent,[6] and 35 percent is also a rough approximation of the empirical ratio of RWAs to total assets across the UK banking system. Applying this ratio, total assets might have been 100 ÷ 35% = 285.7 times capital: banks could be leveraged by a factor not far short of 300 under the old rules. Given that UK bank CET1 ratio capital requirements are currently 8 times what they were before the crisis, current requirements would still allow banks to be leveraged by a factor of 285.7 ÷ 8 = 35.7. This is a high level of leverage and high leverage was a major contributor to the severity of the crisis.
And I have not taken account of how UK banks could increase their leverage further by switching into assets with lower risk weights or by moving positions from their banking books to their trading books.
The bottom line is that a large percentage increase in capital requirements does not represent a large absolute increase in capital requirements if the base is low to start with.
And why was the base so low? Because Basel II imposed extremely low minimum capital requirements. Correctly interpreted, Governor Carney’s ’10 times’ narrative (or to use the more accurate figure, an ‘8 times’ narrative) does not imply that banks now face high capital requirements; it is, instead, a damning indictment of the inadequacy of Basel II.
One can also look at this issue another way. The capital ratios that matter are not those based on the highly unreliable RWA measure: the ratios that matter are the leverage ratios. Basel II had no minimum required leverage ratio and Basel III introduced a minimum required leverage ratio of 3 percent. But this 3 percent minimum required leverage ratio is specified with Tier 1 capital as the numerator[7] and the leverage exposure as denominator. When one converts this leverage ratio into the ratio of CET1 to total assets using Basel rules and recent data for UK banks, the minimum ratio of CET1 to total assets is about 2.4 percent, allowing for a leverage factor of over 40.
Therefore, one can say that when it comes to the leverage ratio, the Basel III requirements are not 8 times or 10 times or even 20 times what they were: they are infinitely greater than what they were. Even so, they are still too low.
It is not for nothing that Martin Wolf has described Basel III as the mouse that did not roar.[8]
Slinging around multiples of capital ratios is great fun, but there is a serious side too. The question one must ask is why does the Bank choose to emphasise this 10 times narrative to make their point that UK banks are now strong again, when the underlying facts on the ground – the empirical leverage ratios (see here or here) – do not support that narrative.
To illustrate, consider the following chart (Chart B.2) from the BoE’s November 2016 Financial Stability Report.
Major UK Banks’ Leverage Ratios

Sources: PRA regulatory returns, published accounts and Bank calculations.
Notes to Chart B.2:
(a) Prior to 2012, data are based on the simple leverage ratio defined as the ratio of shareholders’ claims to total assets based on banks’ published accounts (note a discontinuity due to introduction of IFRS accounting standards in 2005, which tends to reduce leverage ratios thereafter).
(b) Weighted by total exposures.
(c) The Basel III leverage ratio corresponds to aggregate peer group Tier 1 capital over aggregate leverage ratio exposure. Up to 2013, Tier 1 capital includes grandfathered capital instruments and the exposure measure is based on the Basel 2010 definition. From 2014 H1, Tier 1 capital excludes grandfathered capital instruments and the exposure measure is based on the Basel 2014 definition.
This chart shows that in terms of actual capital-to-asset ratios, we are roughly back to 2002 levels and about 1.5 (not ten) times higher than 2006-7, the eve of the crisis. And these are book-value figures. In terms of market values, the Bank of England’s own data suggest that UK banks’ capital ratios are well below what they on the eve of the crisis.[9]
Ten times capital requirements or no, UK banks are still far from resilient. One can only hope that they will not have to go through another major stress any time soon.
End Notes
* I thank Anat Admati, Tim Bush, Jim Dorn, James Ferguson, Gordon Kerr and Sir John Vickers for helpful discussions on this topic.
[1] M. Carney, “The future of financial reform,” 17 November 2014, p. 4.
[2] M. Carney, public statement made on the morning of June 24th 2015 shortly after the result of the Brexit vote was announced.
[3] M. Carney, “Redeeming an unforgiving world,” 26 February 2016, p. 8.
[4] M. Carney, Letter to G20 leaders, 3 July 2017, p. 1. As an aside, I have a bone to pick with Governor Carney’s statement that banks “have” capital. To say that banks “have” capital (or that they “hold” or “hoard” capital, etc., other common errors of the same nature) is to suggest that capital is an asset to a bank and thereby subscribe to the ‘capital is a rainy day fund’ fallacy that has been debunked by Admati and Hellwig. Capital is a source of finance to a bank, not an asset. Banks do not “have” capital; they issue it. Dr. Carney confuses what banks invest in with how they finance themselves, and it is important to get these things right.
[5] The situation is however quite complicated and I won’t attempt to summarise it here. Instead, I would refer the reader to J. Vickers “The Systemic Risk Buffer fro UK Banks: A Response to the Bank of England’s Consultation Paper,” Journal of Financial Regulation, Volume 2, Number 2, pp. 264-282.
[6] See Bank of England (2015) “Supplement to the December 2015 Financial Stability Report: The framework of capital requirements for UK banks,” box 1.
[7] This Tier 1 capital measure is Basel III specific and is not to be confused with core Tier 1 or Tier 1 as defined under Basel II!
[8] M. Wolf, “Basel: the mouse that did not roar,” Financial Times, 10 September 2010.
[9] To illustrate, the market-value Simple Leverage Ratio, the ratio of Shareholder Equity to Total Assets, fell from 8.0 percent going into 2006 to 5.28 percent in November 2015, representing a decrease of 34 percent. See K. Dowd, "The Fiction of the 'Great Capital Rebuild'," Adam Smith Institute blog, July 6th 2017.